MTF Analysis: How to Master Forex Trading by Using Multiple Time Frames the Right Way
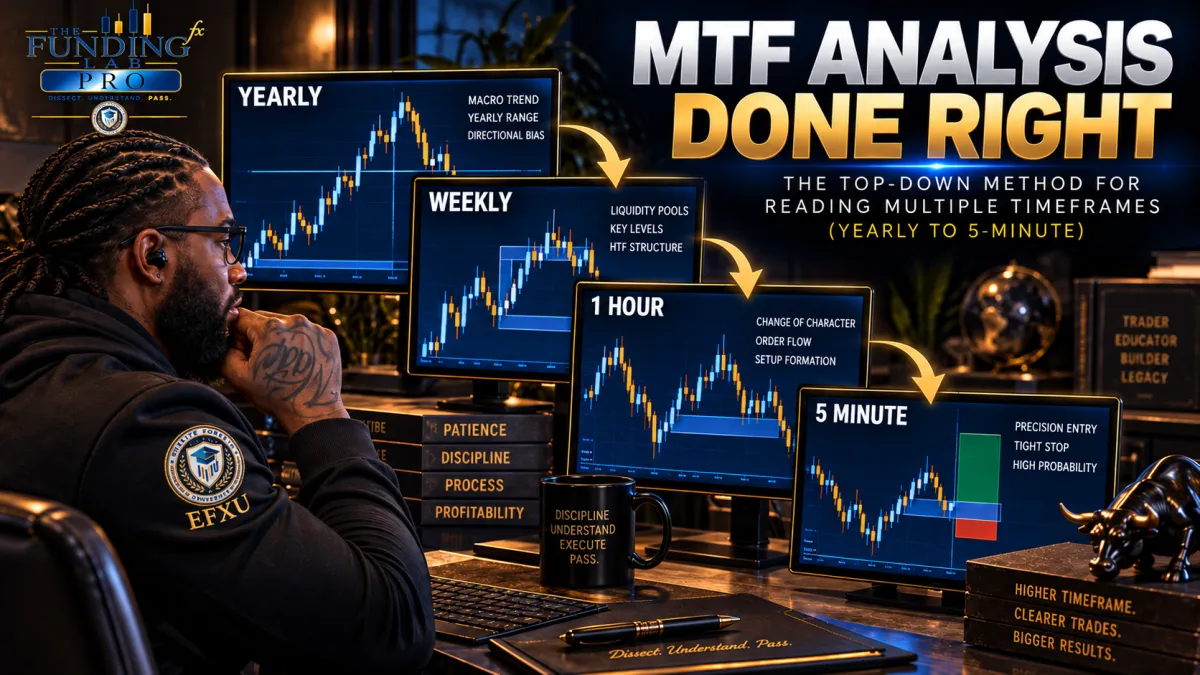
MTF Analysis Done Right: The Top-Down Method for Reading Multiple Timeframes (Yearly to 5-Minute)
Most traders think multi-timeframe analysis means slapping ten indicators across five charts and hoping they all agree. RSI here, MACD there, a moving average cloud, some volume bars, a Fibonacci tool with the retail levels everybody and their momma can see. Then they wonder why they keep getting stopped out.
Here's the problem, and it's the same one I see in the Challenge Passers room over and over: they start in the middle of the book and try to get to the end of the story.
Real MTF analysis isn't indicator soup. It's reading the market from the top down, in the correct order, so the higher timeframe hands you your lower timeframe trade instead of you guessing at it. It's structure, liquidity, and the driver, stacked in sequence. Let me show you the exact timeframe ladder I move through as a swing trader, the handful of indicators I actually trust, and the two mistakes that quietly cook people who think they're doing MTF right.
Key Takeaways
Multi-timeframe (MTF) analysis is a mechanical top-down read, not a pile of indicators that happen to agree.
The single biggest MTF mistake is starting in the middle. People open the 4-hour and skip the higher timeframe that actually sets direction.
My stack runs yearly to weekly to 1-hour to 5-minute, and each timeframe has one specific job.
The yearly gives directional bias, the weekly gives liquidity pools, the 1-hour gives the shift, and the 5-minute gives the sniper entry.
I trust structure, order flow, the 13/50/200 EMAs, and deep (non-retail) Fibonacci levels. I don't use MACD or volume, and I only use RSI on the 4-hour and higher.
MTF done right is just the technical layers of the TFT sandwich: where you are, why price moved there, and when to execute.
What Multi-Timeframe Analysis Actually Is
Let me define it the way I teach it, not the textbook way.
MTF analysis is a mechanical way to read the market timeframe by timeframe so you can see one thing clearly: whether the market has maintained its trend or shifted it. That's it. You move from the biggest picture down to the smallest, and each timeframe confirms or challenges what the one above it told you.
Now let me be honest about something the guru blogs won't tell you. MTF analysis is not a crystal ball. Having a multi-timeframe plan does NOT mean you win 100% of the time. Nothing does. What it gives you is a repeatable, structured read so you stop reacting to random noise on a single chart and start making decisions inside the bigger story. It's a process, not a guarantee, and it's not for everybody. But if you'll actually run it in order, it's the closest thing to an unfair advantage you'll find.
My Actual Timeframe Stack
Photon and every other site give you the same generic ladder: weekly, daily, 4-hour, 1-hour, 15-minute. Here's what I actually run, and why it's different.
First, a note on timing. The timeframes I start with depend on where we are in the calendar year, because my read begins with the yearly candle. From highest to lowest, my stack is: yearly, weekly, 1-hour, then 5-minute. I'm a swing trader hunting big moves with tight stops, low risk, and high reward, and this ladder is built for exactly that.
The Yearly: Institutional Directional Bias
I start on the yearly timeframe to read the last completed year's candle. But here's the twist most people miss: I like to come to a fresh chart around three to six months into the year, not January 1st. Why? Because I want to see whether price has pushed above or below the previous year's equilibrium, the midpoint of last year's range. That tells me whether this year is setting up as a continuation.
Say I pull up GBP/AUD and last year printed a bearish candle with a range of about 500 pips. The equilibrium sits at the 250-pip midpoint. So I'll come back to the chart between March and June and ask one question: are we trading above that midpoint? If we are, and the market is lining up for another bearish year, I want to be a seller from above equilibrium. Yearly ranges create zones of sensitivity above and below that midpoint, and those zones are where the real moves start.
The Weekly: Big Liquidity Pools
Next I drop to the weekly view of liquidity. I run a weekly separator so I can see the market broken into weeks, which shows me exactly where the weekly pools of buy-side and sell-side liquidity are sitting. Those pools are magnets. Knowing where they are tells me where price is likely to be drawn before it does what the yearly bias says it should.
The 1-Hour: The Shift
Now I move to the 1-hour, and this is where I prefer to live. I can read both 1-hour and 4-hour order flow from the 1-hour chart, so I don't need to clutter my screen jumping around. More importantly, the 1-hour is where I can see the market change character and likely shift with real participation behind it.
My mechanical sequence on the 1-hour goes like this. I wait for a change of character. Then I wait for a confirmed break of structure in the direction I want to trade. Then, and only then, I wait for the retracement that comes after that confirmed break of structure. That retracement into my area of interest is the market telling me it's ready to go in my direction. No change of character, no break of structure, no trade. I don't force it.
The 5-Minute: The Sniper Entry
When price taps my retracement zone on the 1-hour, I scale all the way down to the 5-minute for execution. On the 5-minute I'm looking for the same exact pattern to play out that I just saw on the 1-hour, a smaller mirror of it, to confirm my trigger. That's what gives me a sniper entry with a very tight stop loss, which is what lets me run a low-risk, high-reward profile as a swing trader. Small risk in, big move out.
So the full ladder, top to bottom: yearly for bias, weekly for liquidity, 1-hour for the shift, 5-minute for the trigger.
The Indicators I Actually Trust (and the Ones I Ignore)
Let me set the record straight, because the recycled MTF blogs bury you in tools that do nothing but clutter your chart.
Exponential moving averages: yes. I run the 13, 50, and 200 EMAs. When they give me a positive crossover, that's a buy trigger. A downside crossover is a sell trigger. I call this proof of sponsorship, my confirmation that real money is actually backing the move and I'm not out here alone.
RSI: only up high. I don't use the RSI on lower timeframes. In my opinion it earns its keep on the 4-hour and above, where it shows me a market that's genuinely overbought or oversold. On the lower timeframes it's just noise.
MACD: no. Volume indicator: no. I read order flow directly for participation. I don't need a MACD or a volume bar to tell me what structure already shows me.
Fibonacci: yes, but not the way retail does it. I use Fibonacci retracement, but I throw out the standard retail levels. Everybody sees those, which means those are exactly where the banks hunt stops. I work from the deeper levels: the 0.618, 0.705, 0.79, and 0.875. That's where price gets mitigated when the crowd has already been shaken out.
Two housekeeping tools. I keep one tool marking every week's Sunday opening price at all times, plus my weekly separator. That way I can sit on the 1-hour and still see the weekly pools of liquidity without piling a bunch of junk onto my chart.
That's the whole toolkit. Structure, order flow, three EMAs, deep Fibs, and clean weekly markers. Compare that to a chart smothered in RSI, MACD, and volume, and you'll understand why most people can't see the trade for the indicators.
How MTF Lives Inside the TFT Sandwich
If you've read my stuff before, you know I teach the TFT sandwich: Technicals, Fundamentals, Technicals. Multi-timeframe analysis is how you actually run the technical layers of that sandwich.
Here's the flow. The technicals have to tell me where I am first, based on the year's trading range. In a Goldilocks setup, I'm looking for a bearish yearly move and I'm sitting above the previous year's equilibrium, so I can look for a sell down. That's the first T, done across timeframes.
Then I go to the fundamentals. I ask what narrative made last year a bearish year in the first place, and I check my sources to see if that overarching driver is still in place, or has a real chance of coming back if it stepped away. That's the F.
Then I come back to the technicals for the entry. My setup comes from the range, my deep Fibonacci levels, and the order flow shift on the 1-hour that confirms the market has turned back in the direction of the yearly move. That's the closing T. MTF is the vehicle that carries you through all three layers in order. Risk management is KING. If you can't manage risk, you're COOKED, and reading the timeframes in sequence is how you keep your risk defined the whole way down.
The Trap: Starting in the Middle of the Book
Two mistakes cook traders who think they're doing MTF.
The first is believing the plan is bulletproof. Because they have a multi-timeframe process, they assume it'll work every single time, and when it doesn't, they panic and abandon it. MTF gives you a mechanical read of whether the trend held or shifted. It does not give you certainty. Expect to be wrong sometimes and size accordingly.
The second is the big one: they start in the middle of the book and try to get to the end of the story. They open the 4-hour chart, decide that's high enough, and then drop straight to the 5-minute or the 1-minute to trade. But your 4-hour trend can be pointing one way while your daily and higher trend are pointing somewhere else entirely. Trade a lower-timeframe move off nothing but 4-hour analysis and you'll get run over by a higher timeframe you never even looked at. You have to let the higher timeframe hand you the lower timeframe move. Start at the beginning of the book, every time.
The Proof: The Trade That Looked Like a Sell
Let me show you this working in real life.
I recently took a strong buy on GBP/NZD using this exact top-down read. And here's the thing: on the 1-hour, GBP/NZD looked like it wanted to sell. A lot of traders would have shorted it right there.
But I'd already done my homework from the top down. Based on the yearly trading range, I knew exactly where price sat and which direction I should favor. Then I checked the driver. That particular week, there was a fundamental narrative making the pound strong. On the other side, the New Zealand dollar was cutting interest rates, and New Zealand's economy was already struggling and worsening, which meant more accommodation from their central bank was likely coming. Strong pound, weakening kiwi. To me, GBP/NZD was a clear buy.
So I didn't fall for what looked like a sell on the 1-hour. I recognized it for what it was: a strong pullback into my zone, exactly the retracement my method waits for. My 1-on-1 student Andrea and I bought it. Zero drawdown entry. It shot up a couple hundred pips inside a single week.
That's the whole point of reading the timeframes in order. The single chart was tempting me to sell. The top-down read told me to buy. One of those was right, and it wasn't the single chart.
Read the Book in Order
Multi-timeframe analysis was never about how many indicators you can cram onto a screen. It's about reading structure, liquidity, and the driver in the correct order, top down, so the big picture tells the small picture what to do. Start at the beginning of the book and the story reads itself. Start in the middle and you'll keep getting cooked by a page you skipped.
That ordered, mechanical read is exactly what we drill inside The Funding Lab.
Inside The Funding Lab, EFXU traders learn to run the full top-down process live: reading the yearly range for bias, mapping weekly liquidity, spotting the change of character and break of structure that signal the shift, and dropping down for the sniper entry, all tied to the real driver behind the move. It's a room where getting funded and staying funded is the normal expectation, for $149 a month. That's where multi-timeframe analysis stops being theory and becomes muscle memory.
Stop starting in the middle. Come learn to read the whole book.
Join us inside The Funding Lab at thefundinglab.io.
Frequently Asked Questions
How many timeframes should I use for MTF analysis? I run four with distinct jobs: the yearly for directional bias, the weekly for liquidity pools, the 1-hour for the shift in structure, and the 5-minute for execution. You don't need a dozen charts. You need a few timeframes that each answer a specific question, read in order from highest to lowest.
What is the most important timeframe in multi-timeframe analysis? The highest one you use, because it sets your directional bias and everything below it has to respect that. I start on the yearly candle. When a lower timeframe conflicts with the higher timeframe, the higher timeframe wins. That's the rule that keeps you out of counter-trend traps.
What's the biggest mistake traders make with MTF analysis? Starting in the middle. Most traders open the 4-hour, decide it's high enough, and drop straight to a 1 or 5-minute entry. But the daily and higher trend can be pointing the opposite way, so they get run over by a timeframe they never checked. Always let the higher timeframe hand you the lower timeframe trade.
Which indicators are best for multi-timeframe analysis? Fewer than most people use. I rely on market structure and order flow, the 13, 50, and 200 EMAs for confirmation, and Fibonacci at deeper non-retail levels. I skip MACD and volume indicators entirely and only use RSI on the 4-hour and higher. A cleaner chart reads far better than one buried in tools.
Can MTF analysis help me avoid false breakouts and fake reversals? Yes, that's one of its biggest strengths. A move that looks like a reversal on a lower timeframe is often just a pullback inside the higher timeframe trend. Reading top down lets you recognize the difference, so you buy the dip instead of shorting into strength, or vice versa.
Is MTF analysis good for passing prop firm challenges? It's one of the most useful skills for it. Reading timeframes in order helps you filter weak setups, time tighter entries, and keep your drawdown low while you chase the profit target, which is exactly what a funded challenge demands.
Coach MJ Worthmore is the founder of Elite Forex University (EFXU). This article is for educational purposes only and is not financial advice. Any market, commodity, or geopolitical scenarios described reflect the author's personal analysis at the time of writing and can change at any time. Trading forex and funded accounts involves substantial risk. Individual results are not typical and are not a guarantee of your own results. Always do your own due diligence.